Rules to Better Interfaces (Reports, Charts and Dates) - 7 Rules
If you still need help, visit Website Design and User Experience and book in a consultant.
Graphs are a great way to display data in an easy to follow visual format. Some graphs, however, are easier to read than others. We recommend staying away from 3-D Graphs and keeping it simple! If you have complex data, it's also a good idea to display 2 or 3 simpler graphs rather than one complex one - the aim of the game is to make digesting the information as simple as possible for your audience.
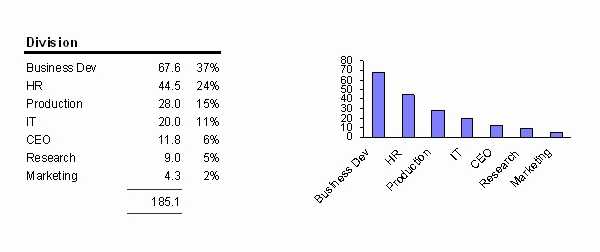
Figure: Good Example - Are your graphs simple to understand? 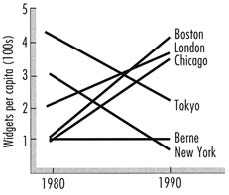
Figure: Bad Example - When there's more than four preceptual units, a graph becomes hard to digest 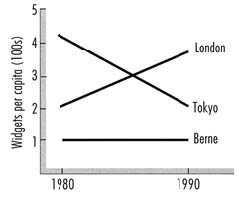
Figure: Good Example - You can split your graphs to make them easer to understand Line graph Line graphs are used to track changes over short and long periods of time. When smaller changes exist, line graphs are better to use than bar graphs. Line graphs can also be used to compare changes over the same period of time for more than one group.
Pie Chart Pie charts are best to use when you are trying to compare parts of a whole. They do not show changes over time.
Bar Graph Bar graphs are used to compare things between different groups or to track changes over time. However, when trying to measure change over time, bar graphs are best when the changes are larger. https://nces.ed.gov/nceskids/help/user_guide/graph/whentouse.asp
This is a fancy way of saying use the right graph for the right purpose. Pie graphs fulfill a specific requirement, unlike a bar graph which is more multi-purpose.
Pie graphs are used to show the general composition of an element. It's good for seeing at a glance what section is dominating, but it doesn't handle details very well.
Figure: Bad Example - This Pie Graph is too complicated and difficult to understand. 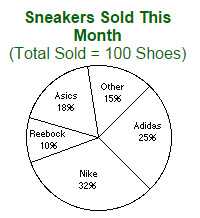
Figure: Good Example - This Pie Graph has been simplified and it is easy to see at a glance that Nike sold the most sneakers this month compared to others. 
Figure: Good Example - This Bar Graph data hasn't even been processed but it's still readable. Date formats should always be kept consistent across applications. More importantly, they should be kept consistent with the operating system's regional settings, otherwise this will cause significant confusion for users.
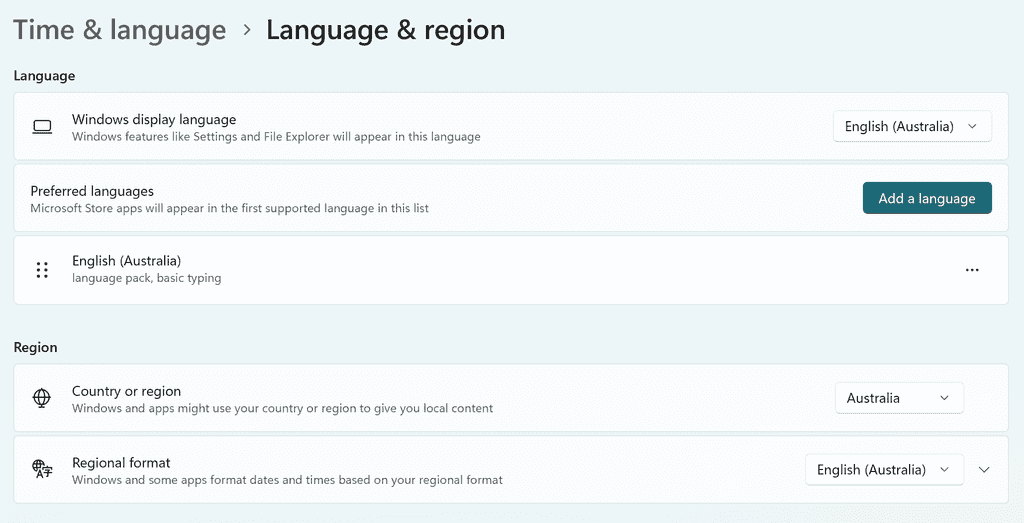
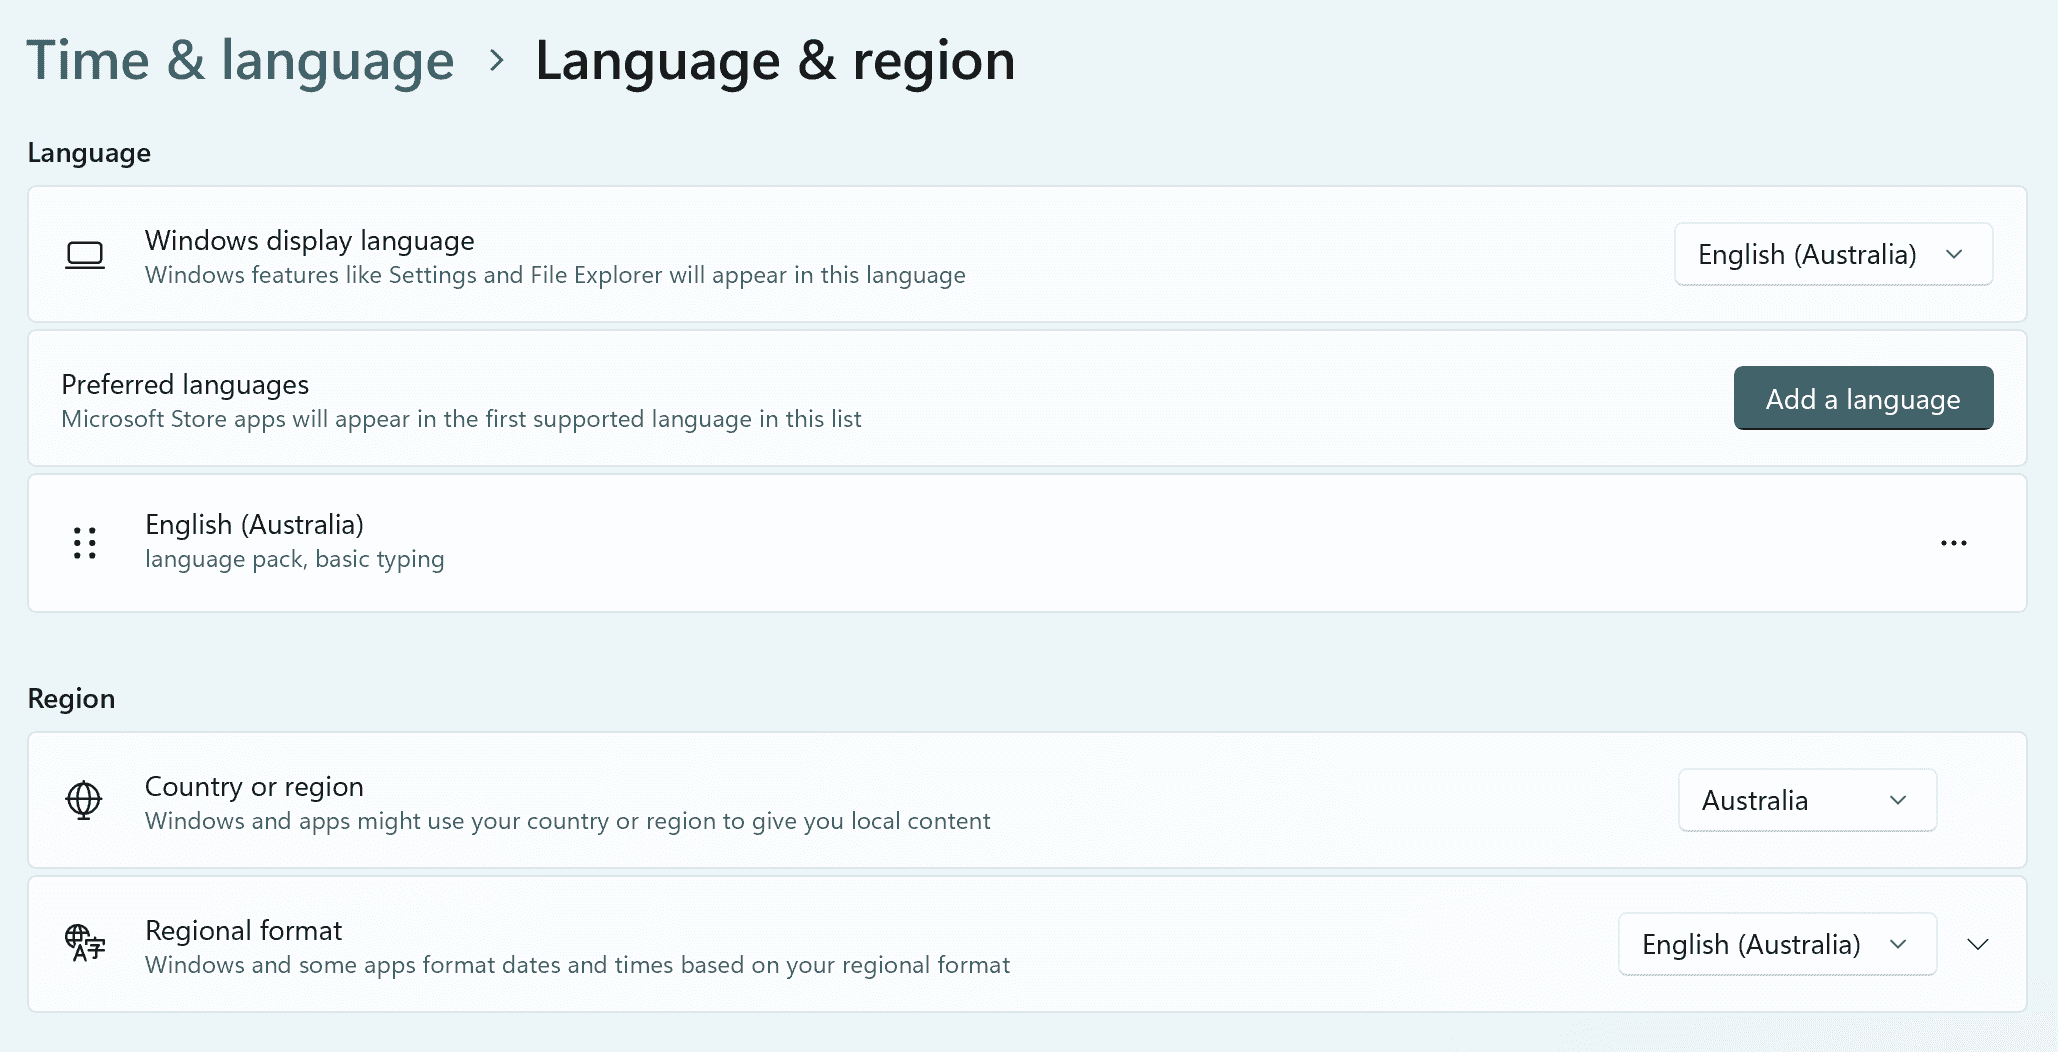
Figure: Operating System's Regional Settings 
Figure: Bad example - Screens with inconsistent date formats 
Figure: Good example - Screens with consistent date formats The best way to do this in your code is to grab the culture information from the application thread and use it to automatically format your Datetime data type. Do not use hard coded datetime formatting strings unless it's absolutely necessary.
startTimeTextBox.Text = resultResults.StartTime.ToString("dd/MM/yyyy hh:mm:ss");Figure: Bad example - Using hard coded formatting string
'VB.NET
'Initial CultureInfo settings for the application
Public initialCulture As CultureInfo
...

...
txtDateCreate.Text = CType(txtDateCreate.Tag, System.DateTime).ToString(initialCulture.DateTimeFormat)
Figure: Good example - Using culture info to format datetime
Browser language settings
It is required to set web browser language to English (Australia) after modifying the computer reginal and language settings. This ensures proper formatting and compatibility, particularly when downloading web pages or accessing specific web content.
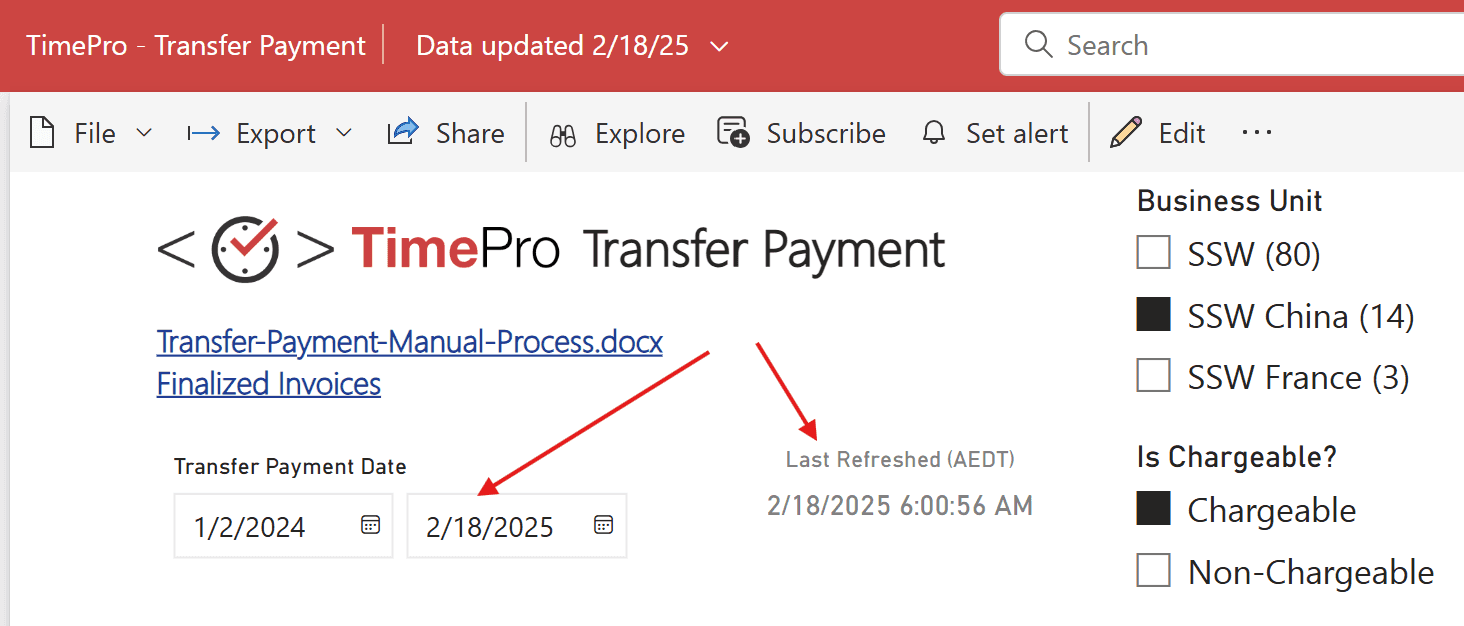
For example, Power BI is date format agnostic and will honor the setting in your browser. If your browser language is set to US English, it may cause date formatting issues.

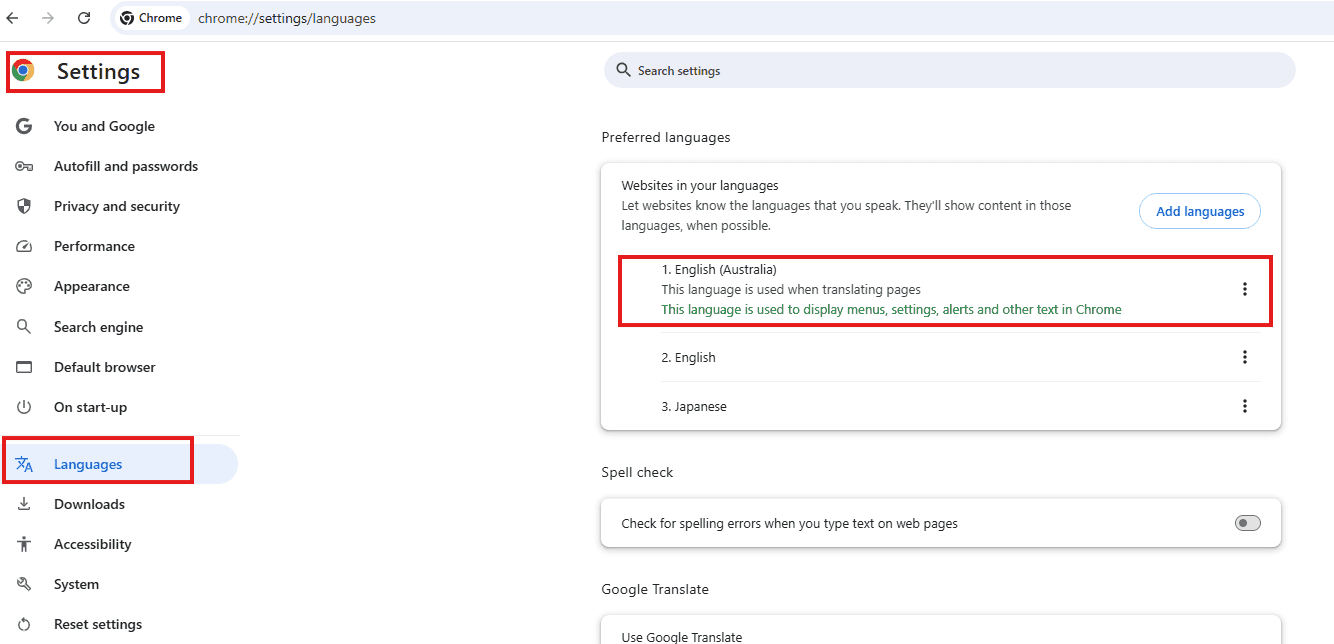
Figure: Date format incorrect due to unmodified web page language settings Go to Browser Settings | Language | Select English (Australia) as the top priority language:
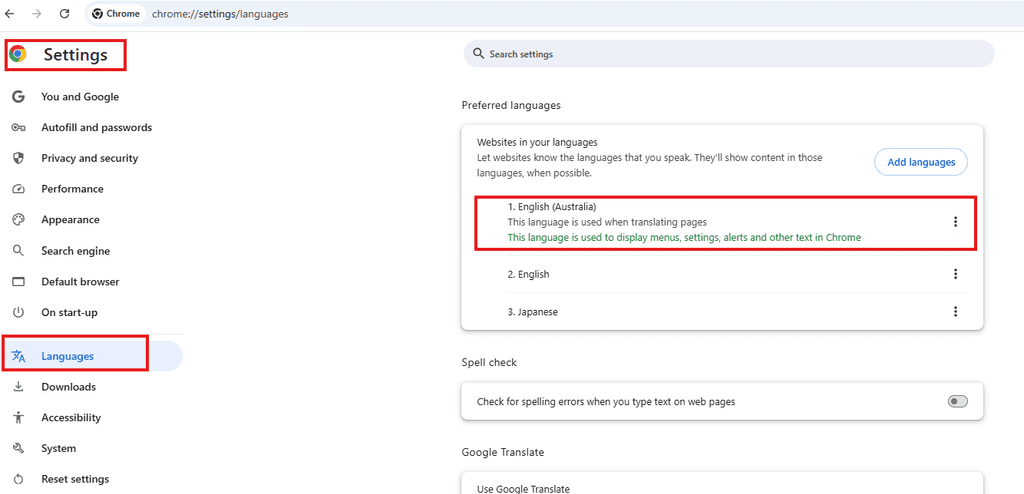
Figure: Set English (Australia) as the top priority in the browser language settings For more information, refer to make sure all software uses English rule.
Time formats should be consistent across your application, to give the application a very professional and consistent look.
Figure: Bad Example - Three screens with inconsistent time formats 
Figure: Good Example - Three screens with consistent formats In Outlook, the Calendar control has a number of important features:
- Saturday and Sunday are displayed at the end
- Days that have data associated with them are bold
- The current day is highlighted with a box
Users are familiar with the Outlook calendar control. When the calendar control is used it should incorporate all of these features of the Outlook calendar control.
Figure: Bad example - Calendar Control - Sunday is at the front, today's date is not highlighted, and items with data are not bolded 
Figure: Good example - Calendar Control - Monday is at the front, today's date is highlighted, and items with data are bolded In OLAP (Online Analytical Processing) cubes, dimensions are ways to categorize data. For example, in a sales cube, you might have dimensions for Time, Products, and Geography. Each dimension can have a hierarchy, and the top level is often represented as "All," which aggregates the data across all members of that dimension.
Default Behavior
By default, the top level of each dimension is labeled as "All" followed by the dimension name. For example:
- "All Products" for the Products dimension
- "All Time" for the Time dimension
- "All Geography" for the Geography dimension
This default labelling can be redundant and might not add clarity to the reports generated from these OLAP cubes.
Improve Clarity by Adjusting the 'All Caption'
Simplify and unify the representation of the top level in each dimension to improve the clarity and appearance of reports.
Adjusted Setting: The 'All Caption' property for each dimension is set to "All" without the dimension name.
Dimension Caption: "All Products"
Dimension Caption: "All Time"
Dimension Caption: "All Geography"Figure: Bad example (Before adjustment) - In this scenario, the prefix "All" followed by a space and the dimension name can make reports look cluttered and does not add meaningful information
Dimension Caption: "All"
Figure: Good example (After adjustment) - In the improved scenario, each dimension's top level simply reads "All," eliminating redundancy and making the data presentation cleaner and more straightforward
How to make the change
- Access the properties - In your OLAP cube design tool, locate the properties for each dimension
- Adjust the 'All Caption' - Change the 'All Caption' property from "All [Dimension Name]" to just "All"
- Apply and test - Save your changes and generate a report to ensure that the top level of each dimension now simply reads "All", making the report more aesthetically pleasing and easier to understand
Adjusting the 'All Caption' property in your OLAP cube dimensions simplifies report headings and enhances readability. This minor change can significantly impact the professionalism and clarity of your reporting solutions.
- Have Selection for filters e.g. Date Ranges
- Have Selection for chart options e.g. Show Legend
-
Don't have selection for chart groupings e.g. By Month or By Product
- Crystal and Access these are built into the report and it is very complex to have a generic solution.
- Also it is disorientating for the user to have this as a selection