Home
>
Archive
>
SSW Standards
>
Developer .Net
>
SSW Rules to Better Reports on the Web
Rules to Better Reports on the Web
-
Do you use the best tools to present Reports to users?
There are many ways to present your data to users over the Web.
Below is a guide on the best options available for the Microsoft
platform, with Pros and Cons for each.
The data
Scenario: I want my customers and staff to be able to see this
data in a useful format. What are my options?
Start Date: 1/1/2006 End Date: 1/4/2006
| Product |
Downloads |
| SSW Upsizing PRO! |
181 |
| SSW Code Auditor |
114 |
| SSW .NET Toolkit |
63 |
| SSW Performance PRO! (for Access 2000,2002,2003) |
60 |
| SSW Exchange Reporter |
58 |
|
SSW Exchange Team Calendar (for Exchange Server 2000,2003)
|
53 |
| SSW Diagnostics |
49 |
| SSW SQL Total Compare |
49 |
| SSW SQL Auditor |
39 |
| SSW Access Reporter .NET For IIS |
34 |
| SSW SQL Deploy |
33 |
| SSW eXtreme Emails! |
31 |
|
Total
|
764
|
The obvious choices for displaying this data on the web are
Reporting Services 2008
,
ASP.NET 2.0
, and
Crystal Reports
. Let's take a look at how easy it is to complete this report
using these and other solutions.
-
Reporting Services 2008
Pros
- Short development time - 3 hours for sample report.
- No Code.
-
Parameters are easy to add to the report and bind to the
data.
- Grouping is simple.
- Drill Down without needing a tree view control.
-
Data drive Subscriptions are supported out of the box.
-
Multiple Export formats out of the box including Excel and
PDFs.
- Built-in security module out of the box
- Visual Designer
-
Ad-hoc Reports via the Report Builder (a .NET client
deployed via ClickOnce)
Cons
-
Poor Parameter support. You are forced to use built-in
controls. For example, you can't have "next month /
previous month" hyperlinks like in ASP.NET 2 (see below)
-
Query string doesn't change when you change the parameter
values in a report. You have to re-submit the page (no
AJAX).
-
Can't separate SQL into a strongly-typed dataset or
middle-tier objects like in ASP.NET (unless you write a
lot of code to support your own provider).
-
Printing support isn't strong - there is no pixel-by-pixel
control possible.
Figure: SSW Product Download Report (Reporting Services
2008)
Conclusion
Reporting Services is the way to go if you do not need
- Dynamic grouping.
- To write to your database via the report.
Demo
See
SSW Exchange Reporter (Samples)
Note: When comparing two sets of values in a report, you
will
avoid showing change as a percentage
-
ASP.NET 2.0
Pros
- Complete control over the rendering of the output
- Query Strings supported
-
Control over the parameters - e.g. "Current Month"
hyperlink
- Can edit data via Databound Controls
Cons
-
Long development time of sample report - 8 hours to
convert including formatting,
sorting
and adding 3rd party parameter controls (like Date Time
Pickers)
-
Graphs - To show a graph you need to code OWC to generate
a .png or get a 3rd Party Control like Dundas Charts
-
No Date/time picker built in - have to use a 3rd party
control or the AJAX Toolkit (or write your own)
-
No export to PDF or other formats - you have to install
Acrobat and print to PDF from the browser
-
No nice Reporting Services interface - you have to create
the navigation yourself
- Have to configure security from scratch
-
Hard to do drill-down. To do this, you need a treeview
with code
Conclusion
Good if you:
- Want editable data
- Want dynamic grouping and cannot go to OLAP
Demo
Figure: SSW Product Download Report (ASP.NET 2.0)
-
Protected Sub Page_Load(ByVal sender As Object, ByVal e As System.EventArgs) Handles Me.Load

        If Request.QueryString("DateFrom") <> "" Then
            txtDateFrom.Text = Request.QueryString("DateFrom")
            txtDateTo.Text = Request.QueryString("DateTo")
        End If


    End Sub

    Protected Sub Button1_Click(ByVal sender As Object, ByVal e As System.EventArgs) Handles Button1.Click


        Response.Redirect(Request.Url.AbsolutePath.ToString + _
            "?DateFrom=" + HttpUtility.UrlEncode(txtDateFrom.Text) + _
            "&DateTo=" + HttpUtility.UrlEncode(txtDateTo.Text), True)


    End Sub
-
Figure: ASP.NET 2.0 - Code to read from and write to the
query string
-
        ...
		<asp:GridView ID="GridView1" runat="server" AllowPaging="True" AllowSorting="True"
            AutoGenerateColumns="False" BackColor="#DEBA84" BorderColor="#DEBA84" BorderStyle="None"
            BorderWidth="1px" CellPadding="3" CellSpacing="2" DataSourceID="SqlDataSource1">
            <FooterStyle BackColor="#F7DFB5" ForeColor="#8C4510" />
            <Columns>
                <asp:BoundField DataField="FileNameURL" HeaderText="FileNameURL" SortExpression="FileNameURL" />
                <asp:BoundField DataField="ProdName" HeaderText="ProdName" SortExpression="ProdName" />
                <asp:BoundField DataField="DownloadCount" HeaderText="DownloadCount" ReadOnly="True"
                    SortExpression="DownloadCount" />
                <asp:TemplateField HeaderText="Graph">
                    <ItemTemplate>
                        <img src="Images/chartpixel.gif"
                             height="10"
                             width="<%#DataBinder.Eval(Container.DataItem,"DownloadCount")%>" />
                    </ItemTemplate>
                </asp:TemplateField>
            </Columns>
            <RowStyle BackColor="#FFF7E7" ForeColor="#8C4510" />
            <SelectedRowStyle BackColor="#738A9C" Font-Bold="True" ForeColor="White" />
            <PagerStyle ForeColor="#8C4510" HorizontalAlign="Center" />
            <HeaderStyle BackColor="#A55129" Font-Bold="True" ForeColor="White" />
        </asp:GridView>
		...
-
Figure: ASP.NET 2.0 - Implement the bar chart in the grid;
-
Crystal
Pros
- Established but not mature!
Cons
- Dead technology
- Licensing is expensive
- Development environment
Conclusion
Only use on solutions that have a big investment in Crystal
|
George Doubinski
said it best: "My major pain with Crystal has been
stability of their development environment. Im not
sure if they've done anything in 2.0 but in 1.1 it was
nearly unusable. The hoops to jump through to simply
change data source was bordering on insane, for
example. The other issue is, obviously, cost when
scaling."
|
-
Access (via SSW Access Reporter)
Pros
- Good Report development environment
Cons
- Access needs to be on the server
- Need an Access License
- Not designed for the web
Conclusion
Only use
SSW Access Reporter
for solutions that have a big investment in Access.
-
-
Figure: Tools like SSW Access Reporter help to display
your Access data on the web
View a
 Sample report

-
Office Web Controls (OWC)
Pros
-
Allow you to embed interactive office documents in to HTML
- Supports updates to the datasource via the control
-
Easy to create - just save a document in "Interactive HTML
format"
- Supports pivot tables, spreadsheets, charts
Cons
-
Require a download or to have office installed (typically
you would only install on an intranet)
-
They run as an ActiveX control - so have limited access to
your local system
-
-
Figure: Office web components enable interactive charts
inside your browser, but require Office to be installed
-
OLAP - Reporting Services 2008 (aka Microsoft's Web
Solution)
Pros
-
Same Pros as
SQL Server 2008 Reporting Services
-
Fast runtime experience - as the data is pre-agreggated in
the cube, we can query data must faster.
- Very fast to develop
-
Flexible - can add lots of dimensions and easily compare
data
Cons
-
Using OLAP is often overkill - in the case of our "Product
Download" sample - for example it is hard to design a
query/cube to compare data from two arbitrary periods of
time because data is pre-aggregated.
-
OLAP - Data Analyzer (aka Microsoft's Rich Client Solution)
Pros
- A visually appealing UI.
- Full drill-down support.
-
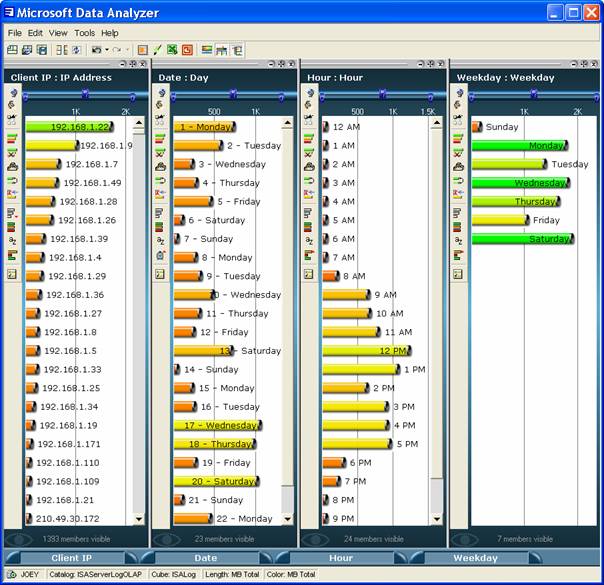
-
Figure: Office Excel 2007 delivers new powerful data
visualization tools
Cons
-
No longer supported. This functionality has been moved
into Excel 2007.
- Microsoft dont have a web version of Data Analyzer.
-
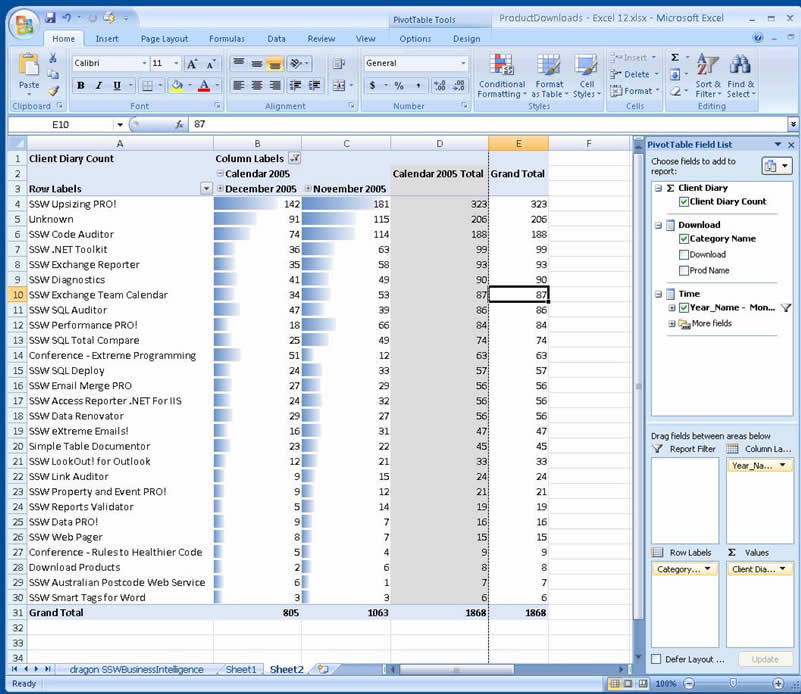
Excel 2007 Data Visualization
-
-
Figure: Office Excel 2007 delivers new powerful data
visualization tools
Pros
- A visually appealing UI
- Full drill-down support with support for Cubes
- Can run over the Web via Web Services
Cons
- Requires rich client Install
- Requires the Excel 2007 License